
WEEKLY & HALVINGS
How to Use the “Weekly chart Trade & Halvings” Indicator:
What It Does:
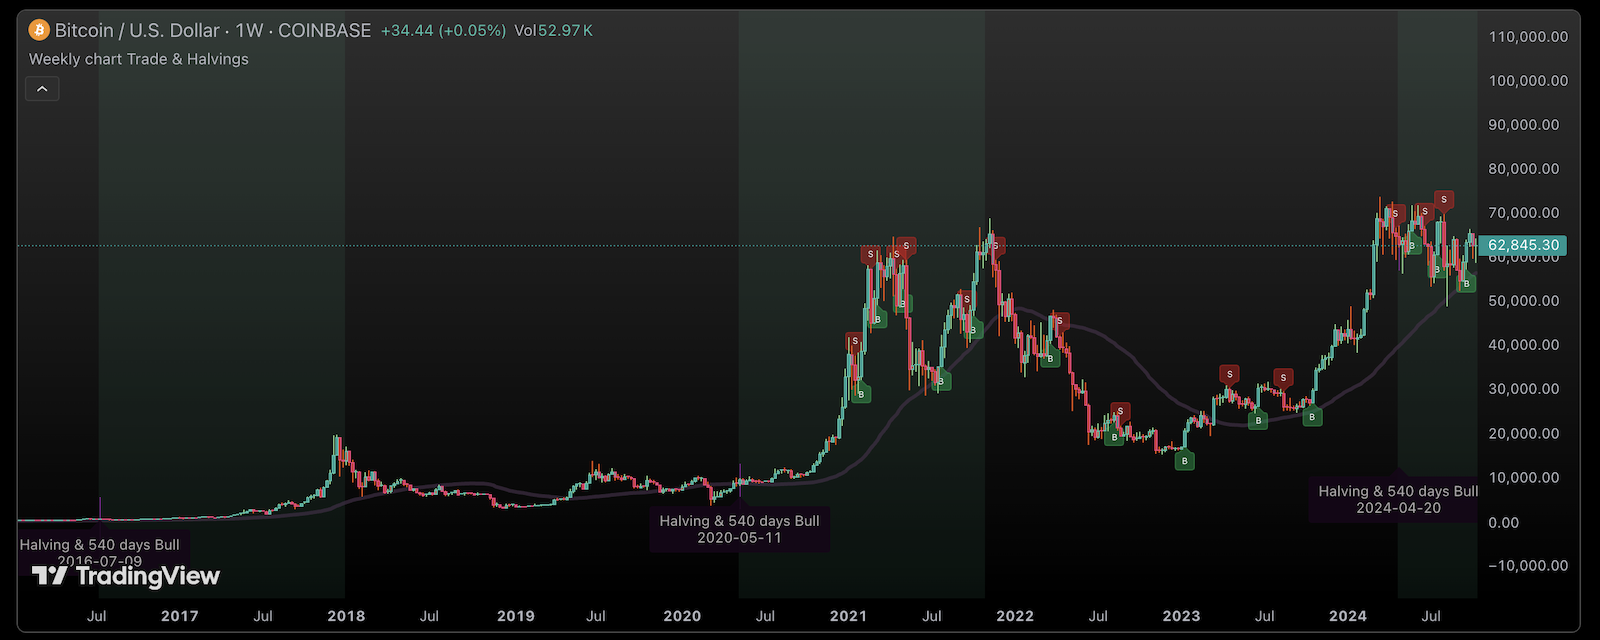
This indicator shows potential buy/sell signals on the BTC weekly chart using an ATR trailing stop and the 50-week moving average. It also marks past halving weeks and highlights key post-halving periods.
Settings:
Key Value – controls sensitivity (higher = fewer signals).
ATR Period – sets how volatility is measured.
Heikin Ashi – toggle to use Heikin Ashi candles for signals.
Signals:
“B” = Buy Signal
“S” = Sell Signal
Candle colors turn green/red based on direction.
Extras:
Plots the 50-week MA line.
Marks Bitcoin halving weeks with arrows.
Highlights a 77-week period after each halving — historically a bullish phase.
📌 Historically, BTC tends to go on a strong run for about 540 days after each halving — usually peaking around the following November. You can clearly see that pattern on the chart.
📈 Buy and Sell signals work pretty well. Even if you’re not actively trading, this weekly indicator is a solid way to keep an eye on what BTC’s doing.
🔗 Free Indicator link: Weekly Chart Trade Halvings