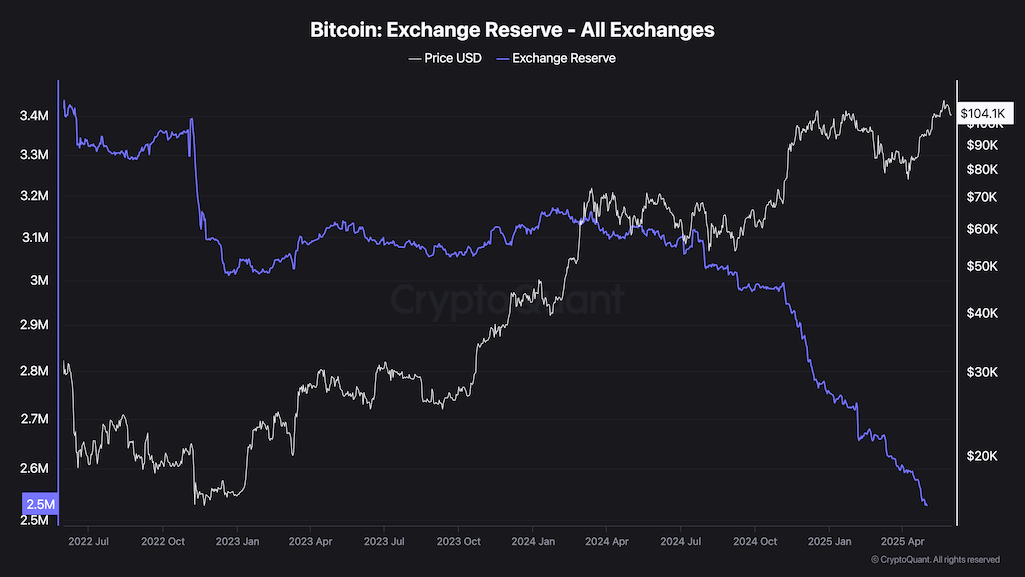
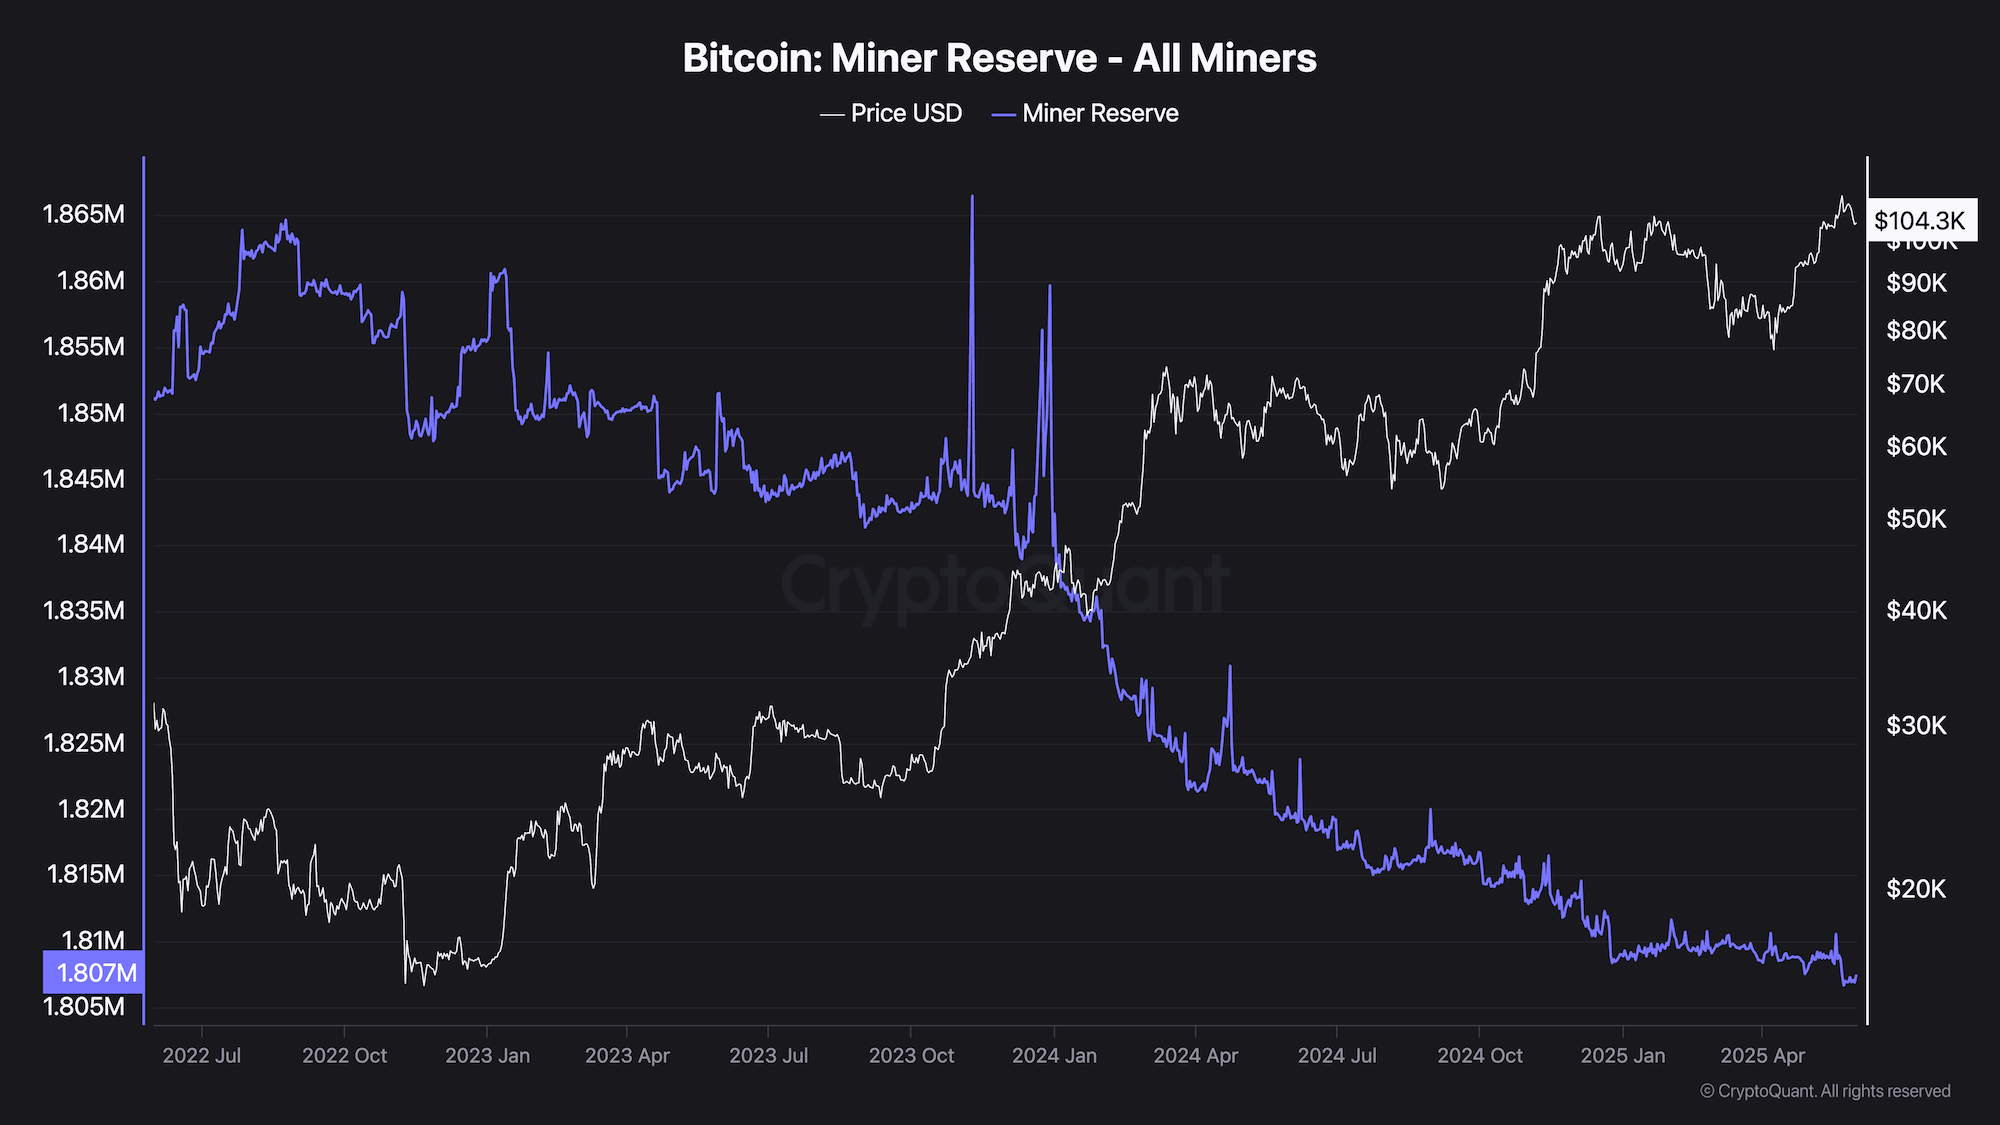
This shows the total number of coins held on an exchange.
If more coins are added, it usually means people are getting ready to sell. That often leads to a price drop.
For stablecoins (like USDT), more stablecoins on the exchange usually means people are preparing to buy, which can push prices up.
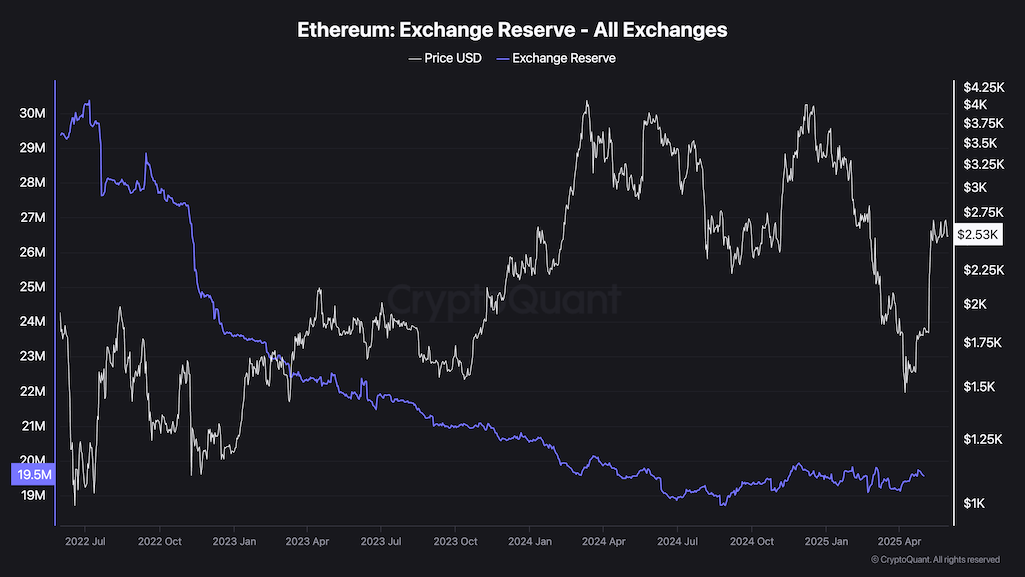
This shows the total number of coins held on an exchange.
If more coins are added, it usually means people are getting ready to sell. That often leads to a price drop.
For stablecoins (like USDT), more stablecoins on the exchange usually means people are preparing to buy, which can push prices up.
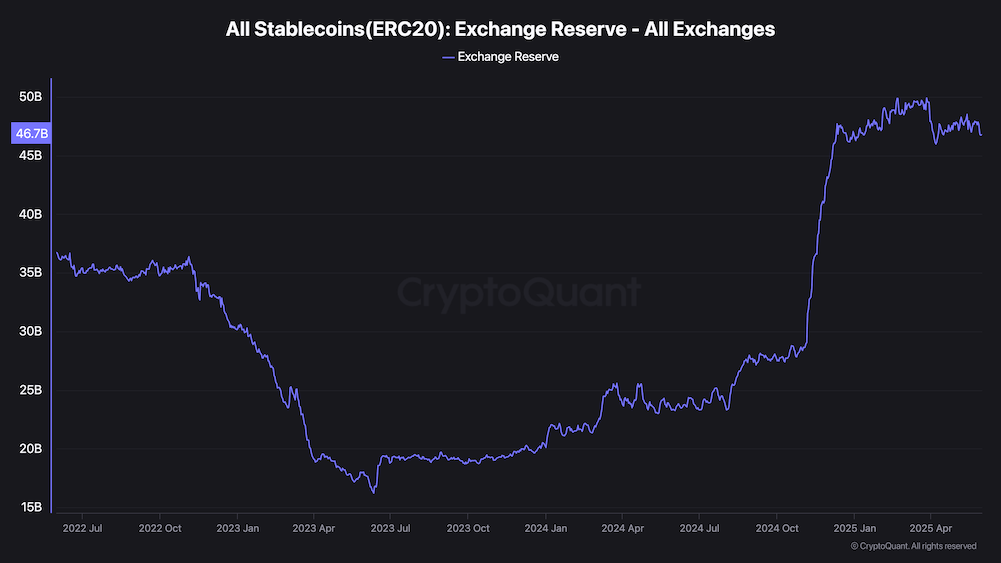
This shows the total number of coins held on an exchange.
If more coins are added, it usually means people are getting ready to sell. That often leads to a price drop.
For stablecoins (like USDT), more stablecoins on the exchange usually means people are preparing to buy, which can push prices up.
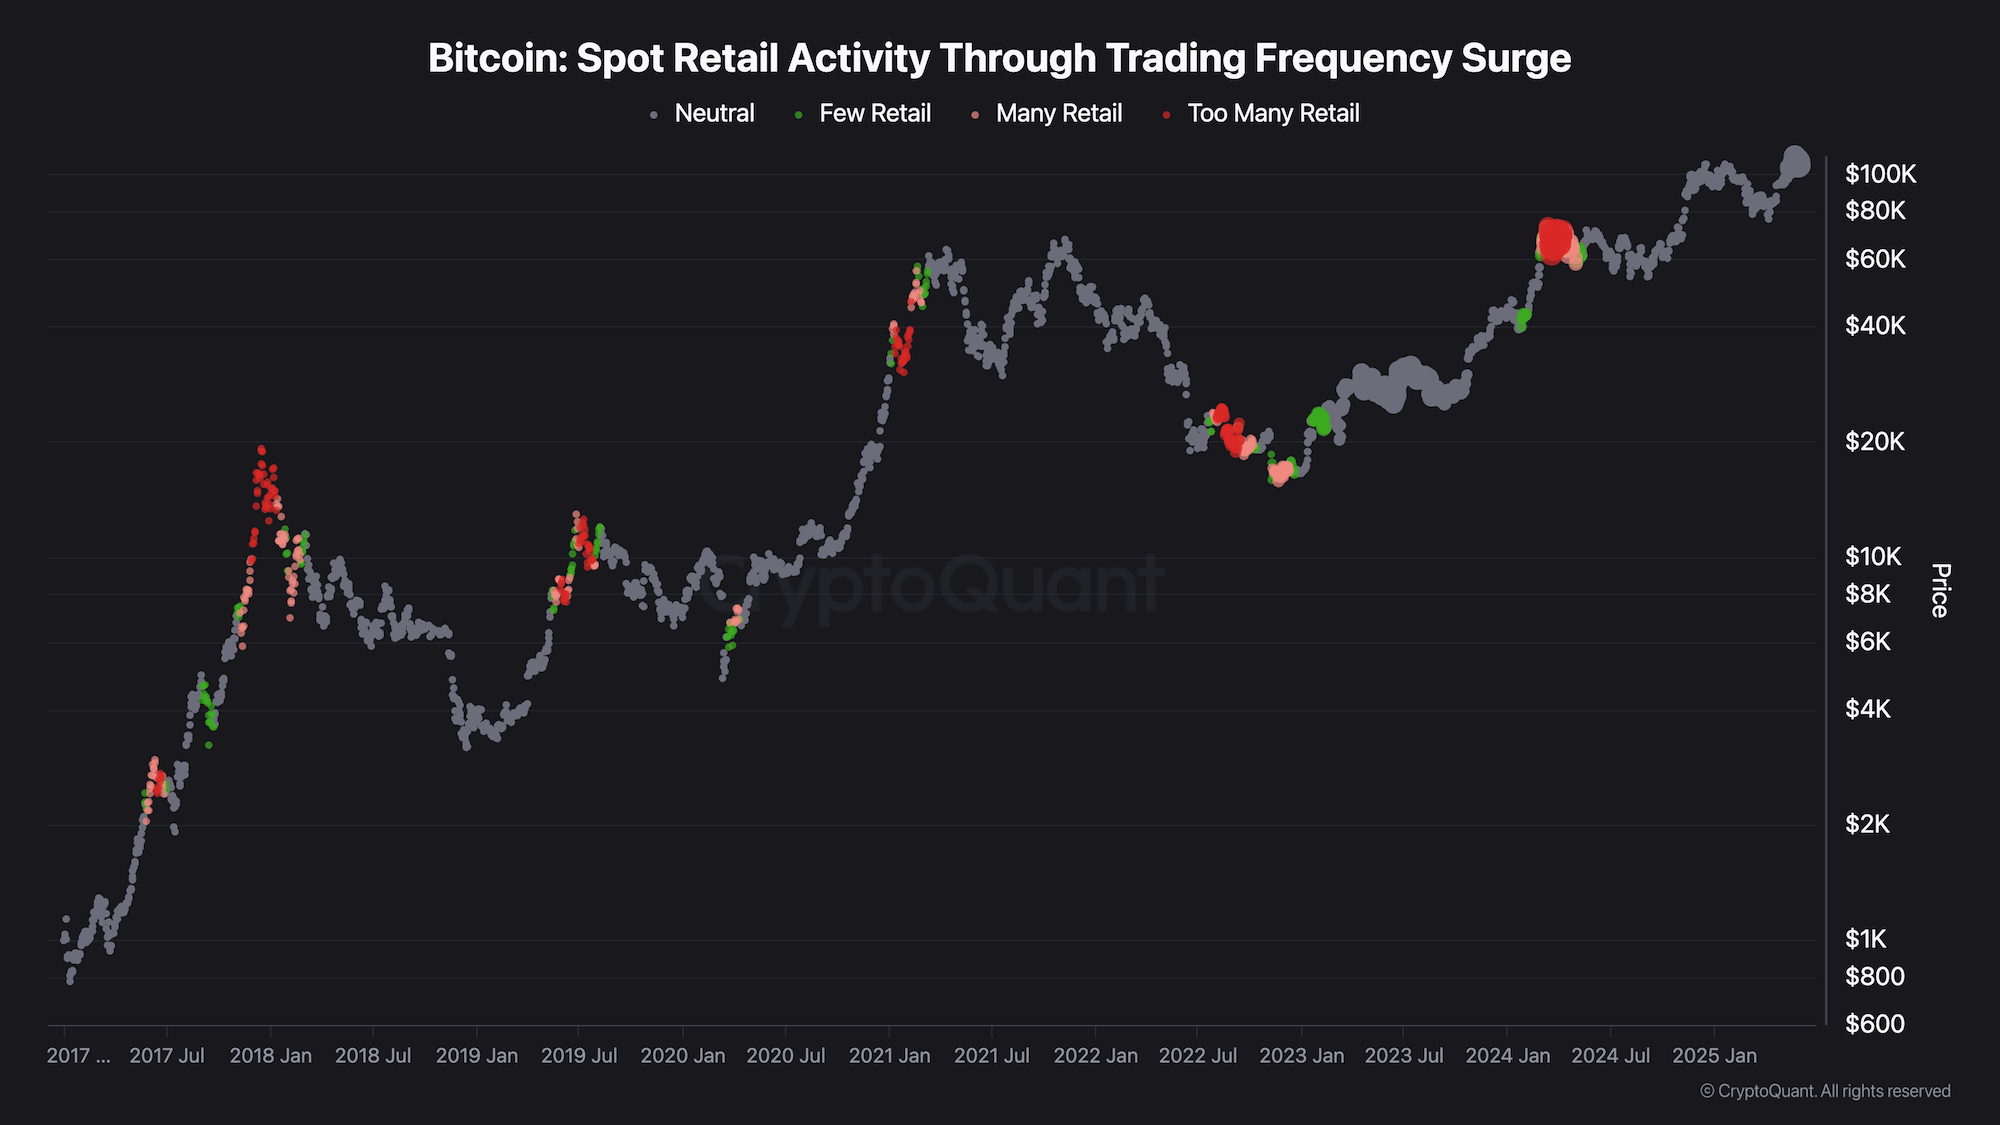
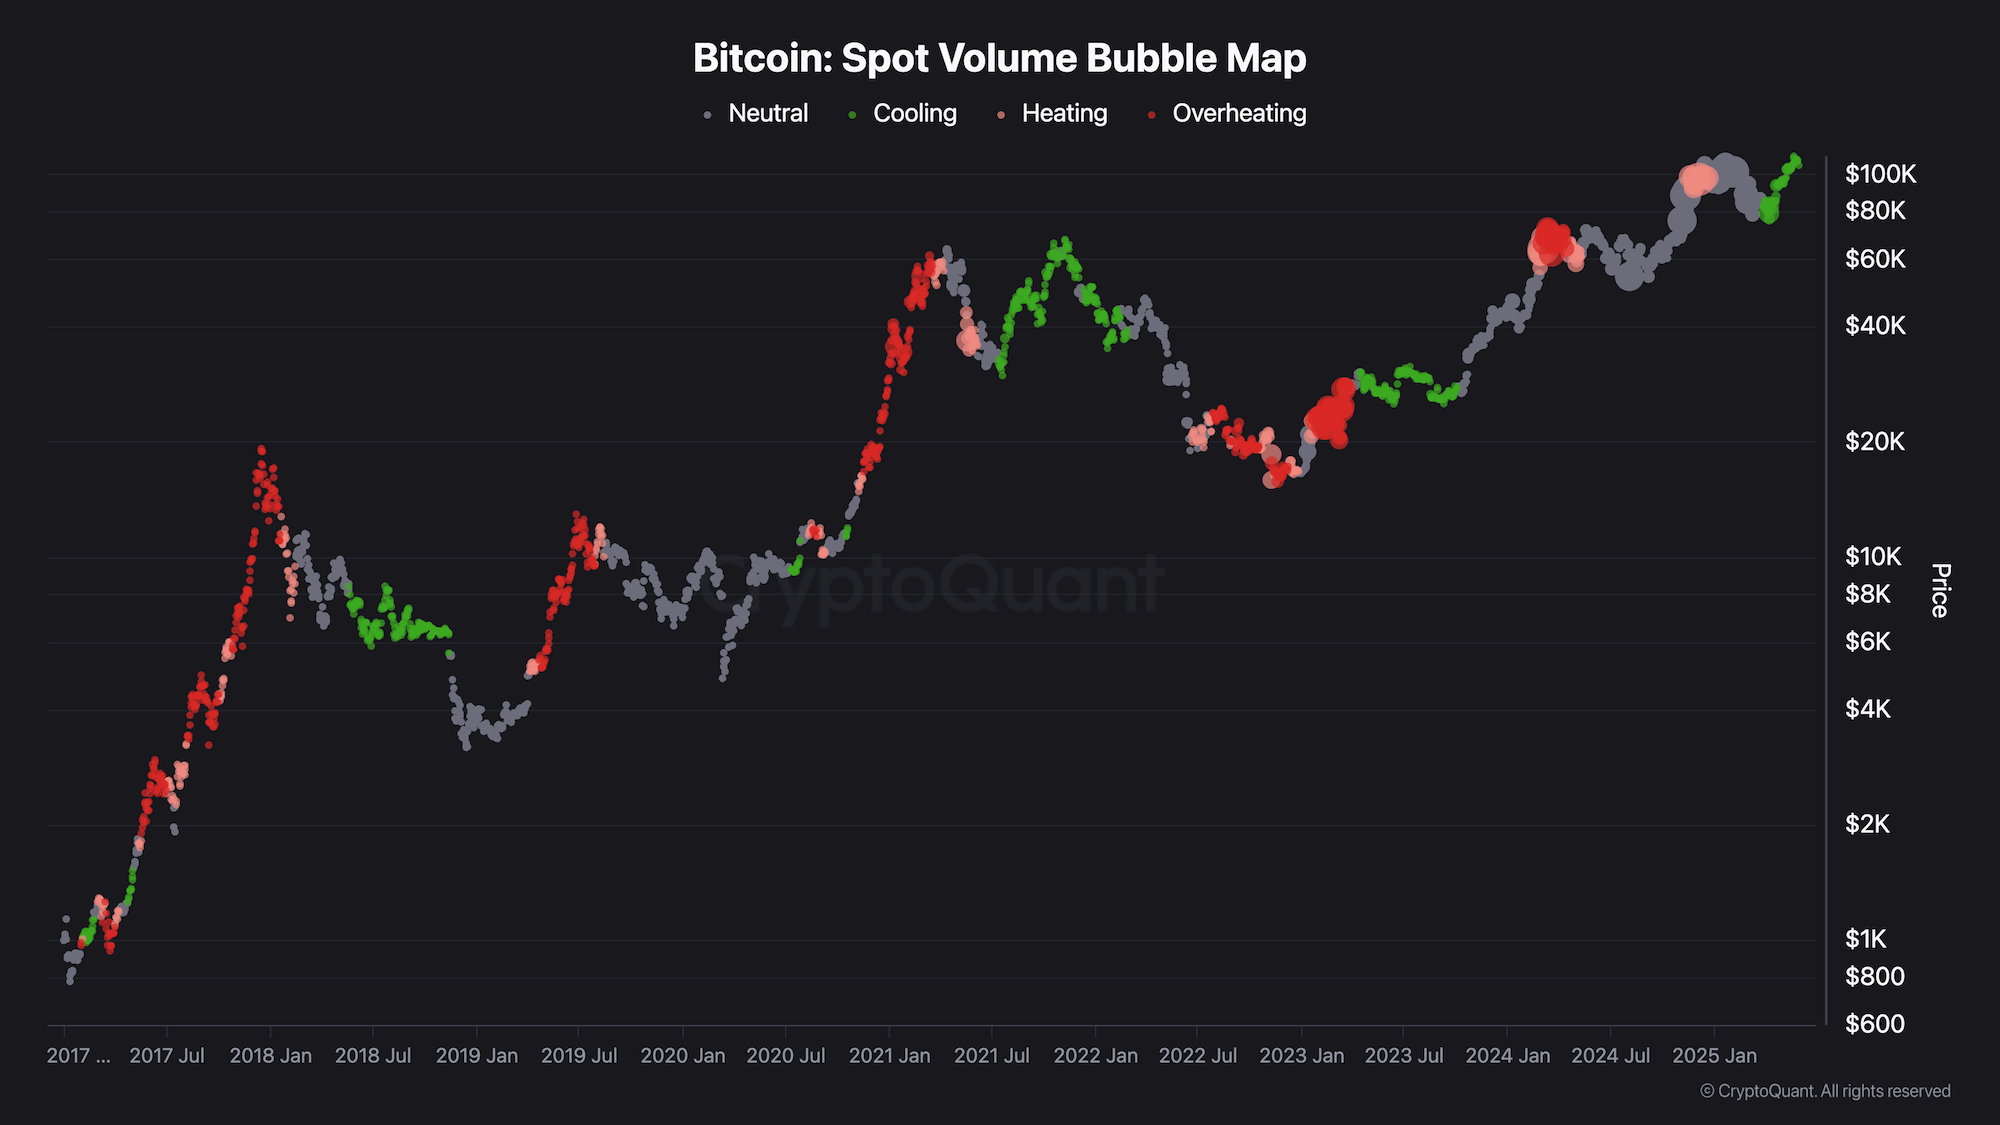
This is a bubble chart showing total trading volume on exchanges.
The size of each bubble shows how much is being traded.
The color shows how fast the volume is changing:
Lower volume = Cooling
Little change = Neutral
Increasing volume = Overheating
Sharp increase = Highly Overheating
If volume stays high but the price doesn’t go up much, it might mean the Distribution Phase — when experienced traders sell to new investors entering the market.
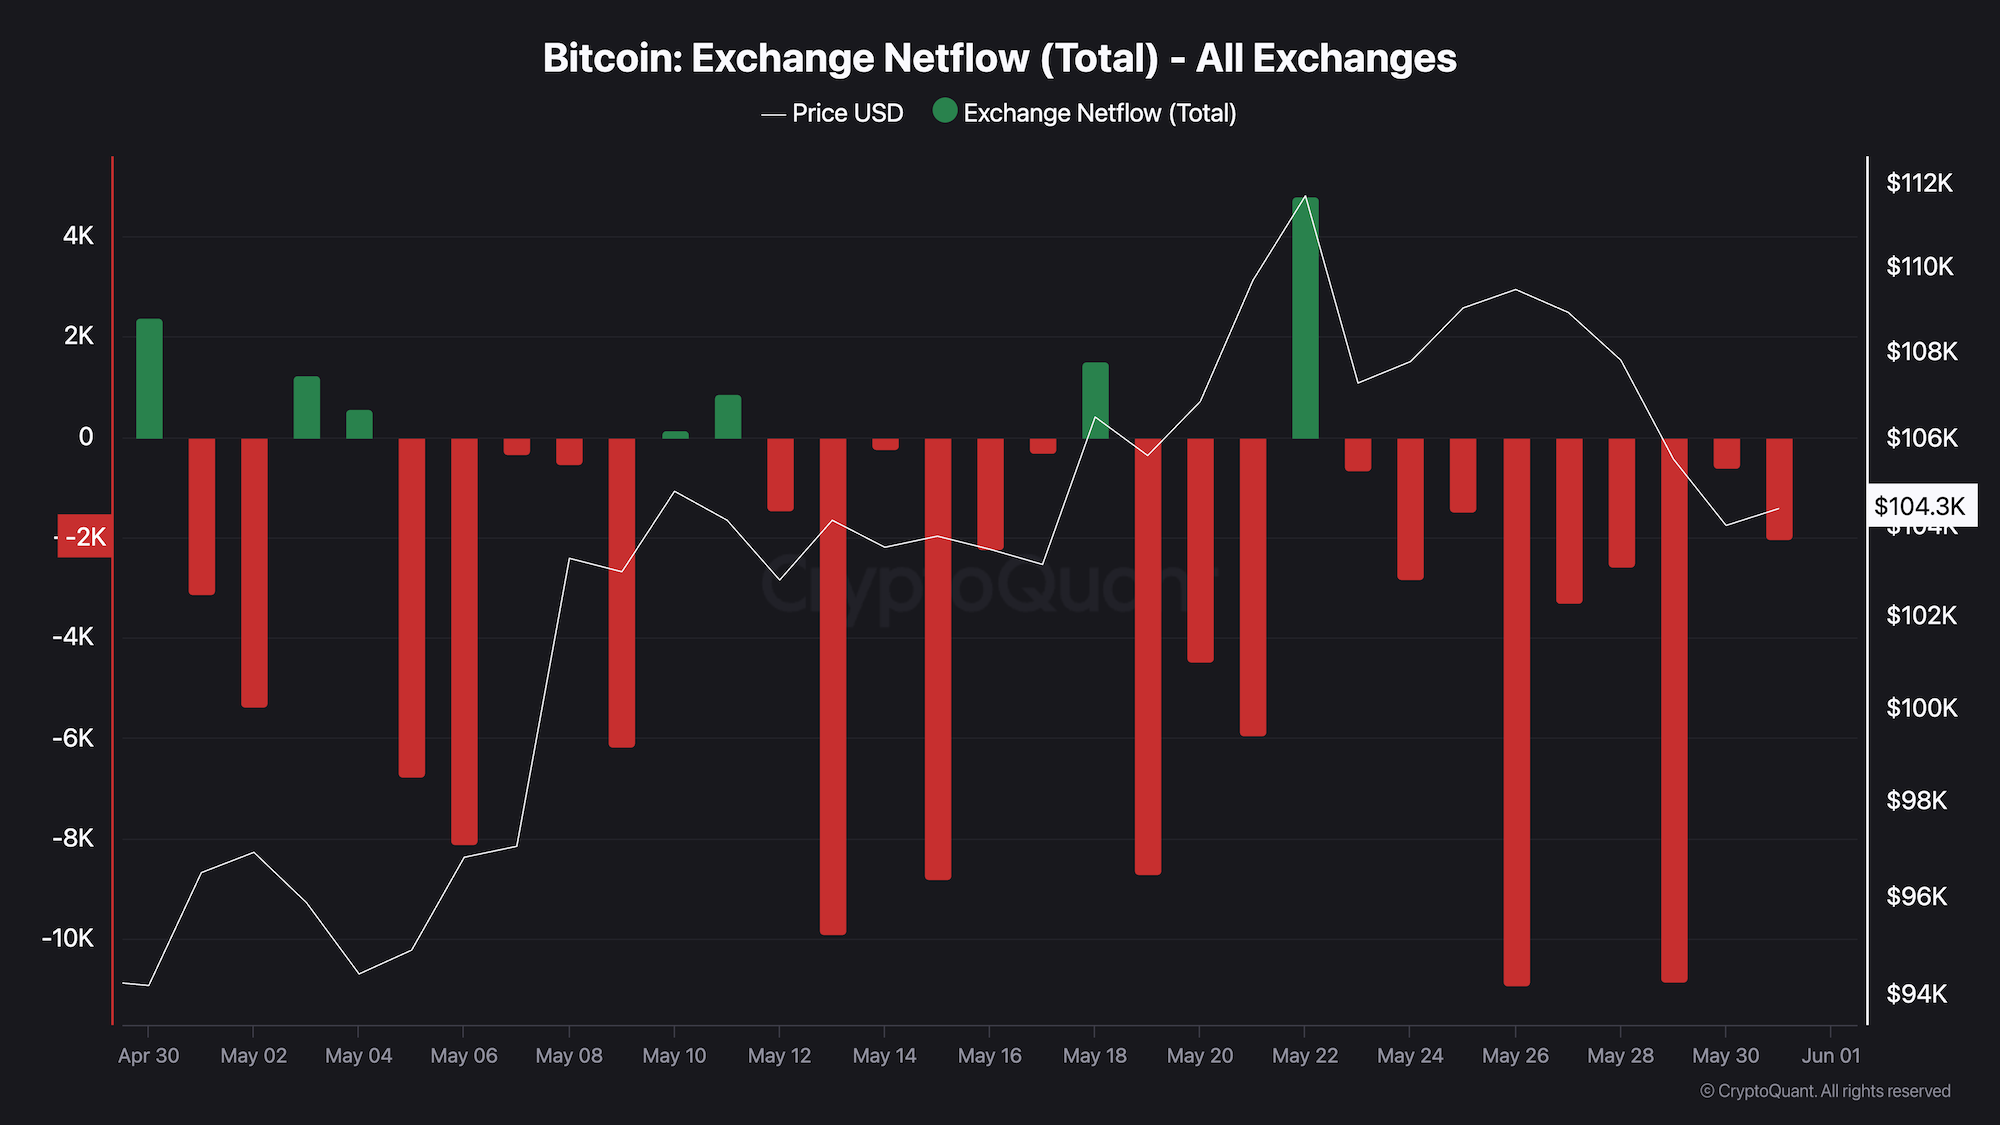
This shows the difference between how many coins go into the exchange and how many leave it. (Inflow – Outflow = Netflow)
If the number is positive, more coins are entering the exchange.
On spot exchanges, this usually means people are getting ready to sell.
On derivative exchanges, it can mean big price moves are coming — either up or down.
Google Trends – Cryptocurrency
A great “crowd” indicator is when people start googling “what is cryptocurrency” more often. The peak of these searches tends to align quite well with the peak of previous bull runs.


Comments are closed.