
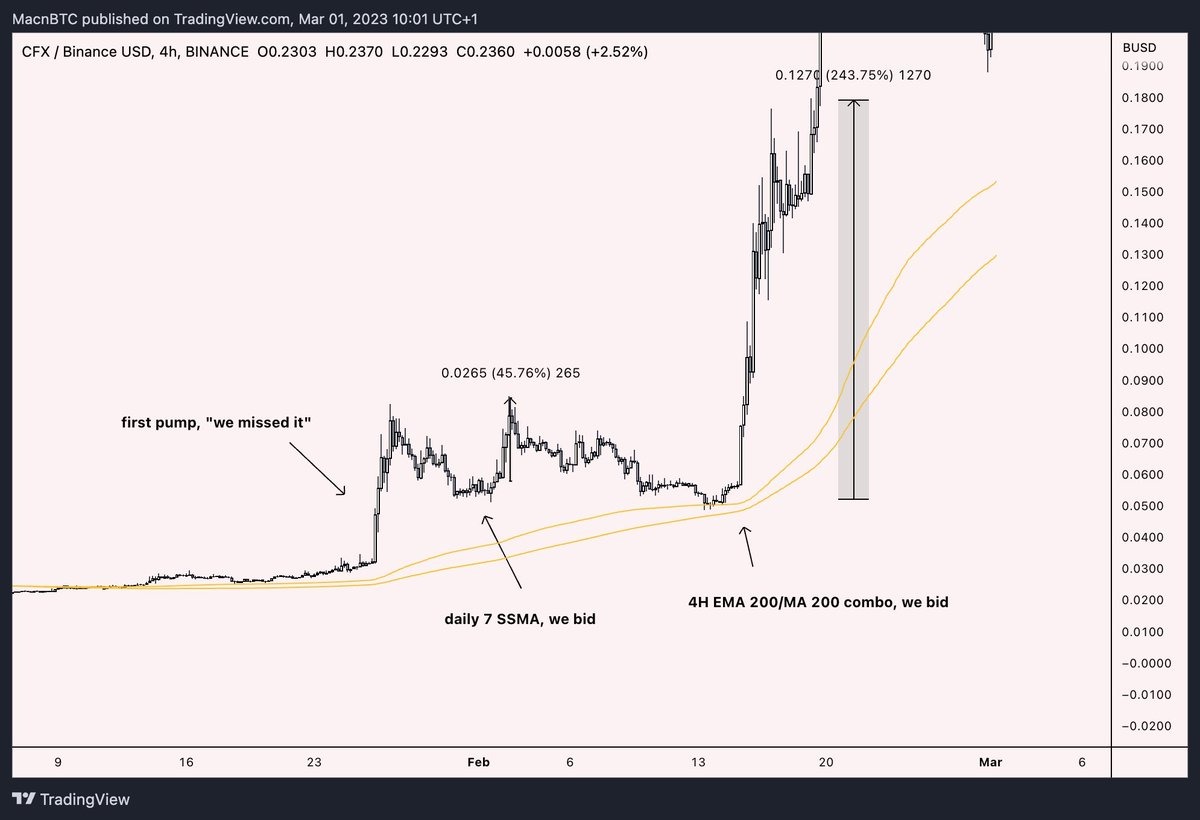
Pullback Buy Strategy #2: Betting on the First Pullback to the EMA 200 / MA 200 Combination
Retests of the daily trend are powerful tools, but the first touch of the EMA 200/MA 200 is even stronger.
This strategy is great because it lets us easily take a trade with a clear stop-loss level.
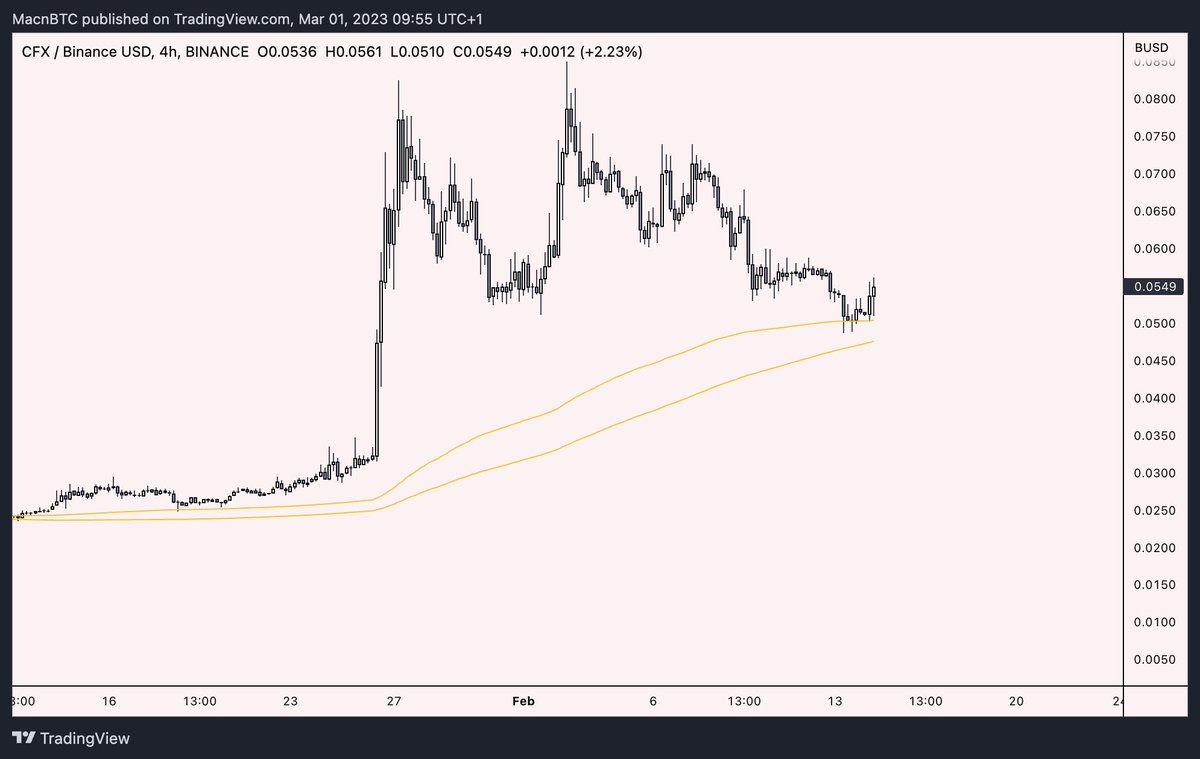
A diagram says more than a thousand words.
$CFX
Now you have two simple strategies for trading pullbacks.
Let’s move on to spotting consolidations and how to play them.
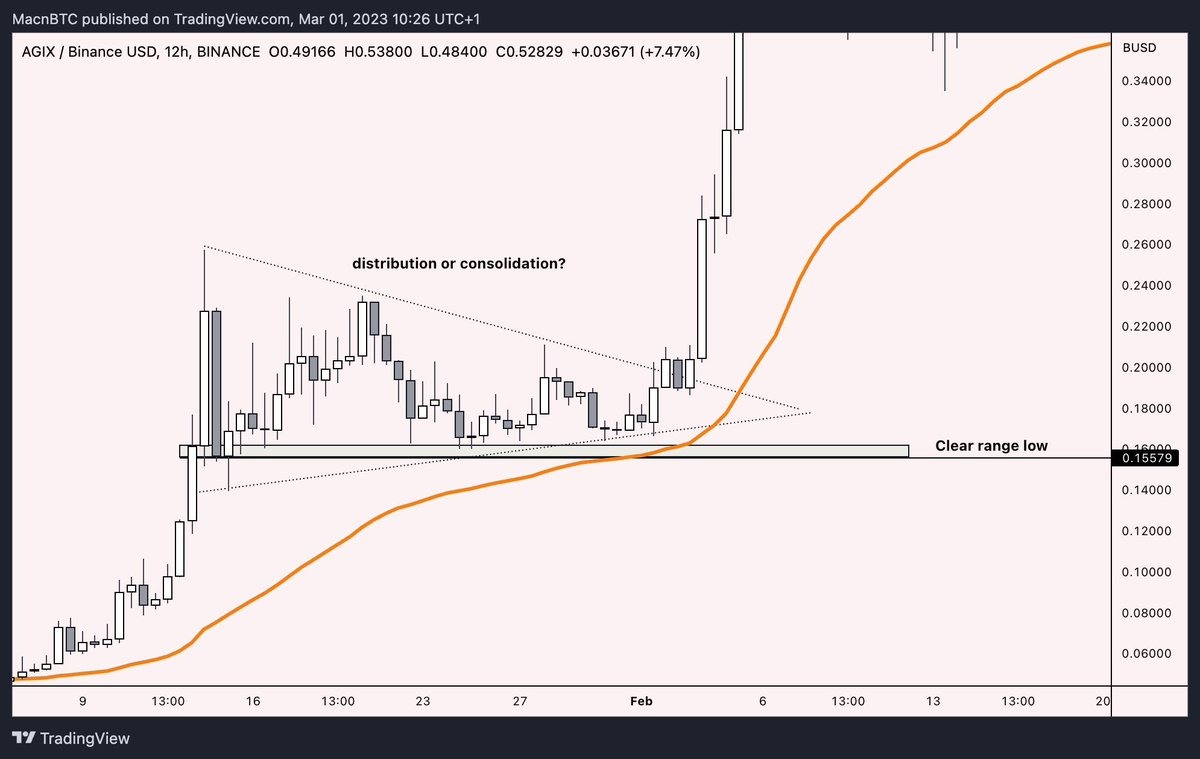
First, I think a lot of people wonder: how do I know if an asset is consolidating or distributing?
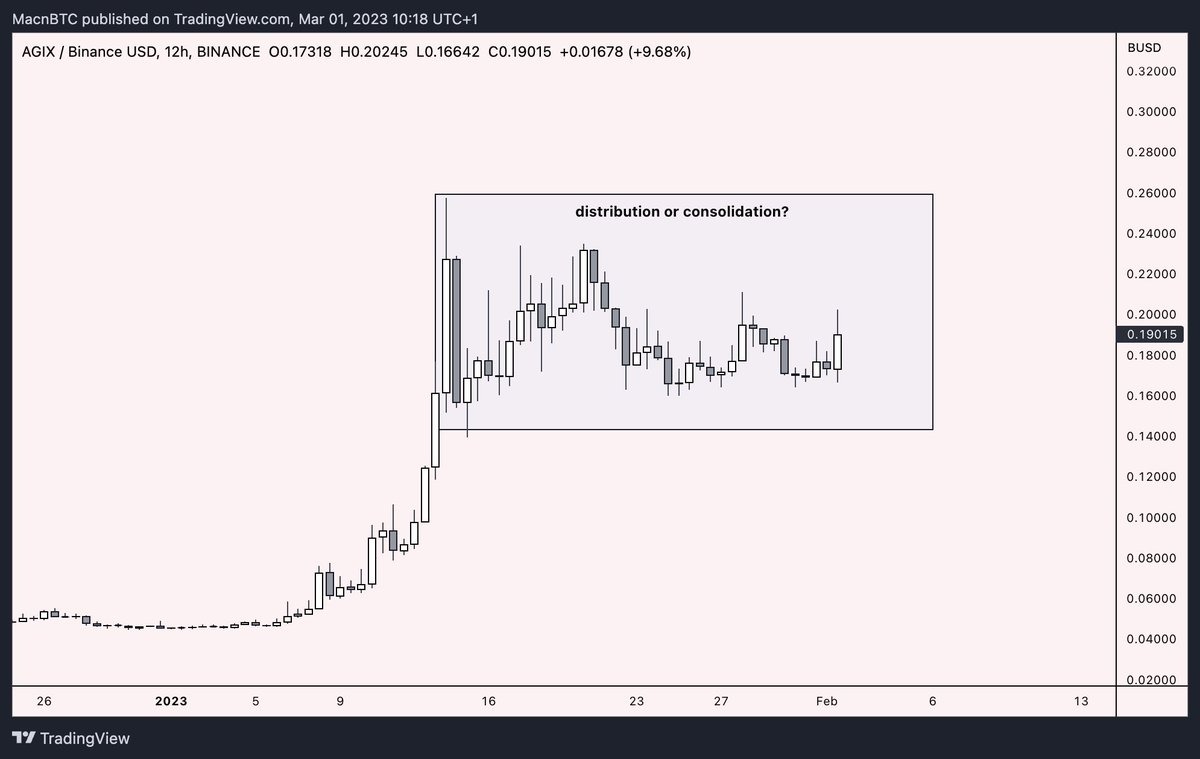
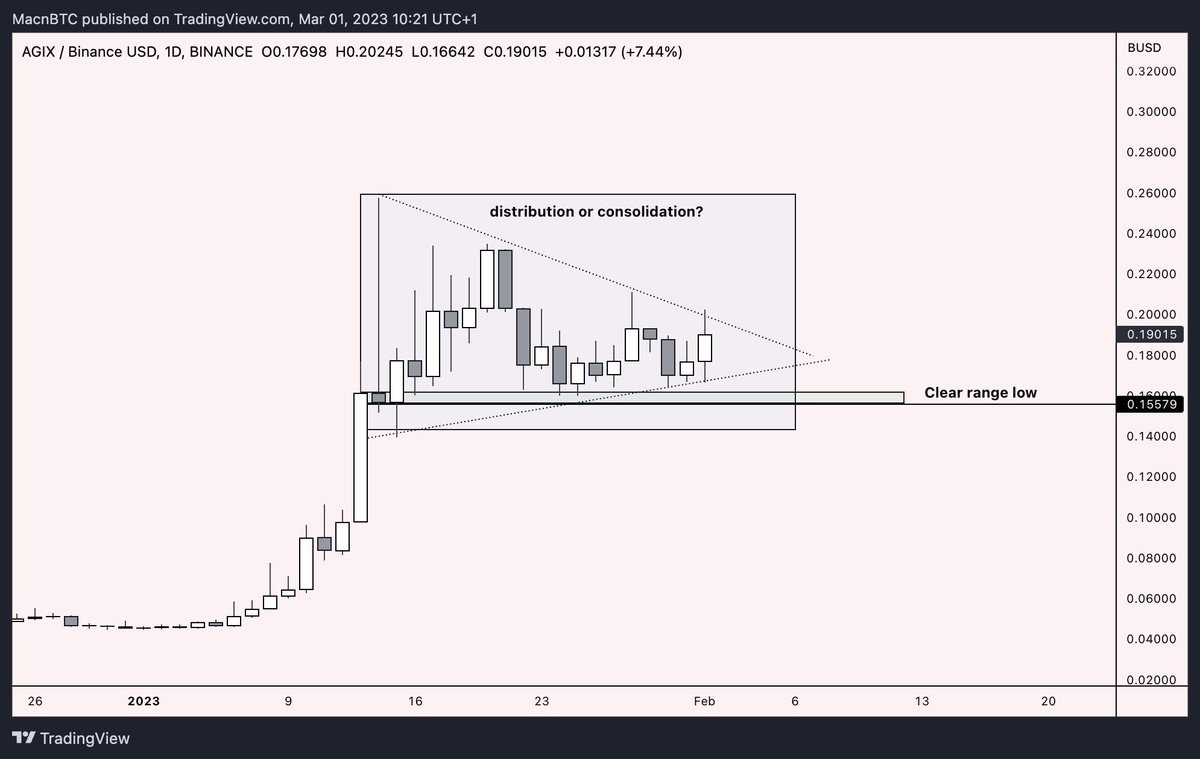
First, consolidations often have a clear range low that can be defended.
When the price approaches the range low, it usually forms small candle bodies and continues to move sideways, often tightening into a triangle shape.
We can use moving averages plus indicators like VWAP or MFI (Money Flow Index) for confirmation.
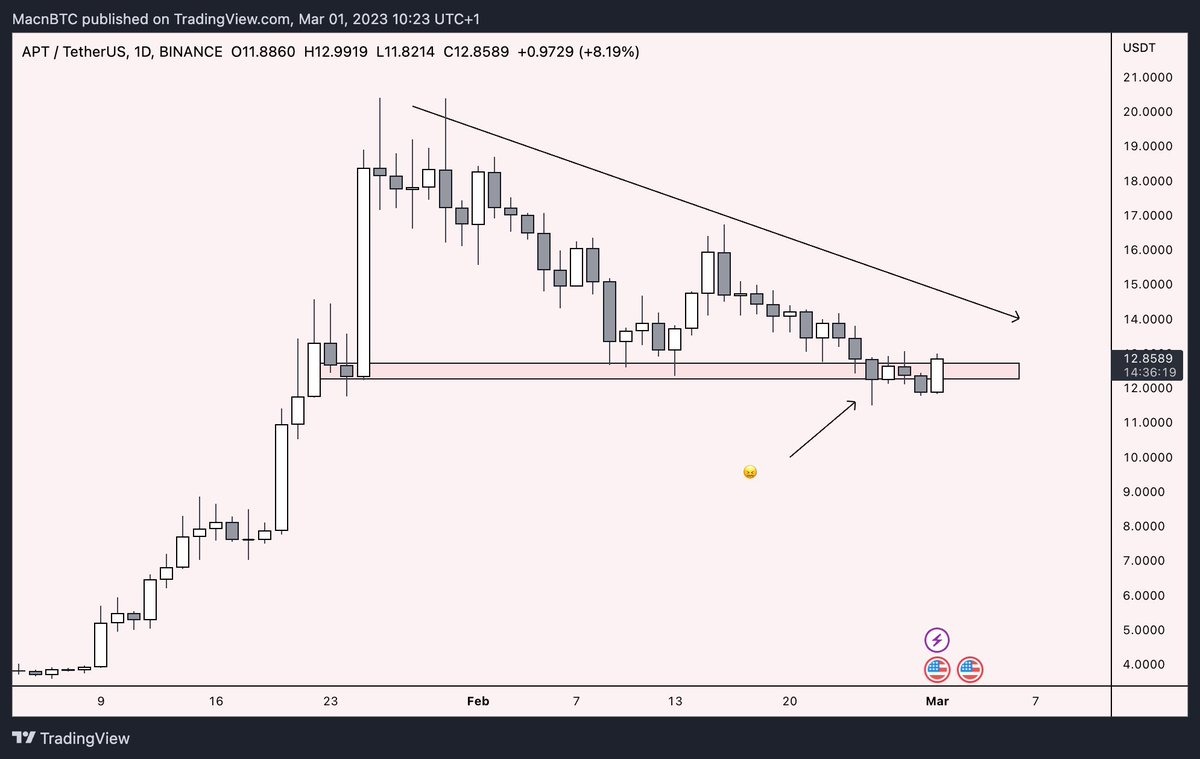
Below is an example of what a distribution looks like.
Market makers often print what I call the death staircase.
Slowly declining price action under hopeless conditions creates most of the liquidity by forcing both short and long liquidations.
Do not get trapped in these situations.
Let’s go back to our $AGIX example.
Simple consolidation trading strategy:
Mark the daily breakout or range low. Place bets if a clear triangle is forming, and use indicators like the 12-hour SSMA 25, 1D SSMA 25, and 4-hour MA 200 / 4-hour EMA 200 to see when the chart is ready for the next move.
Remember: get rid of the mindset “It’s already pumped.”
Author: MACNBTC


Comments are closed.